Clear Capital’s HDI data (market data) is a product that we offer separately but ClearProp includes this information to help review or estimate a property value.
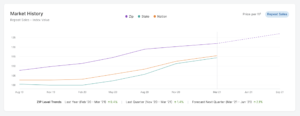
We graph data using 2 models: Price per square foot and Repeat Sales. Depending on the data sample size, we will have more data in one model than the other. The model that has more data is referred to as the “Preferred model”. This will be evident when looking at the graph and you see 3 regions represented on the graph: local (varies between ZIP to county), State and Nation. The price per square foot graph will also include the subject price per square foot so users can see how the subject trends when compared to the rest of the market.
To find market data:
- Select the Market tab (third tab)
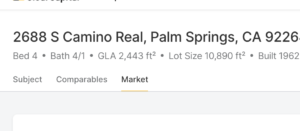
- Scroll down to the market graph
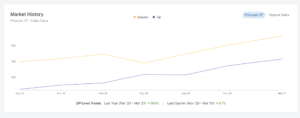
- From the top right corner in the graph component, you can toggle between price per square feet and repeat sales to compare the data between the 2 models.